
JAMB Releases 2020 UTME Application Statistics by State of Origin
JAMB Releases 2020 UTME Application Statistics by State of Origin.
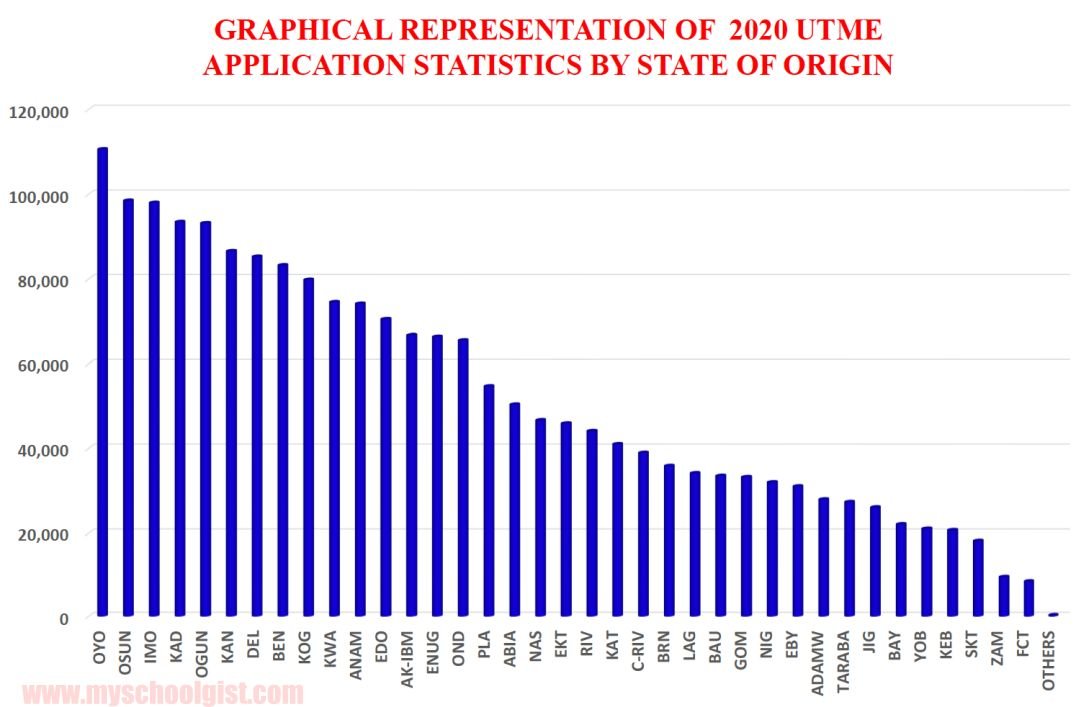
The Joint Admissions and Matriculation Board (JAMB) has released the statistics of candidates that registered for the 2020 UTME and Direct entry based on their State of Origin.
According to the stats released, Oyo state indigenes top the list of candidates that registered for the examination. See the full breakdown below.
JAMB UTME Application Statistics by State of Origin.
| S/N | STATE | TOTAL | PERCENTAGE <%) |
| 1 | OYO | 110,578 | 5.67 |
| 2 | OSUN | 98,472 | 5.05 |
| 3 | IMO | 97,963 | 5.02 |
| 4 | KADUNA | 93,473 | 4.79 |
| 5 | OGUN | 93,179 | 4.78 |
| 6 | KANO | 86,586 | 4.44 |
| 7 | DELTA | 85,265 | 4.37 |
| 8 | BENUE | 83,216 | 4.27 |
| 9 | KOGI | 79,828 | 4.09 |
| 10 | KWARA | 74,502 | 3.82 |
| 11 | ANAMBRA | 74,116 | 3.80 |
| 12 | EDO | 70,522 | 3.62 |
| 13 | AKWA IBOM | 66,751 | 3.42 |
| 14 | ENUGU | 66,380 | 3.40 |
| 15 | ONDO | 65,537 | 3.36 |
| 16 | PLATEAU | 54,639 | 2.80 |
| 17 | ABIA | 50,369 | 2.58 |
| 18 | NASARAWA | 46,638 | 2.39 |
| 19 | EKITI | 45,942 | 2.36 |
| 20 | RIVERS | 44,125 | 2.26 |
| 21 | KATSINA | 40,990 | 2.10 |
| 22 | CROSS RIVER | 39,006 | 2.00 |
| 23 | BORNO | 35,877 | 1.84 |
| 24 | LAGOS | 34,149 | 1.75 |
| 25 | BAUCHI | 33,520 | 1.72 |
| 26 | GOMBE | 33,217 | 1.70 |
| 27 | NIGER | 32,054 | 1.64 |
| 28 | EBONYI | 31,092 | 1.59 |
| 29 | ADAMAWA | 27,977 | 1.43 |
| 30 | TARABA | 27,350 | 1.40 |
| 31 | JIGAWA | 26,081 | 1.34 |
| 32 | BAYELSA | 22,129 | 1.13 |
| 33 | YOBE | 21,063 | 1.08 |
| 34 | KEBBI | 20,732 | 1.06 |
| 35 | SOKOTO | 18,240 | 0.94 |
| 36 | ZAMFARA | 9,590 | 0.49 |
| 37 | FCT | 8,519 | 0.44 |
| 38 | OTHERS | 316 | 0.02 |


![FUWUKARI Notice to 2019/2020 Post UTME Candidates | [Deadline to Upload O’Level Results]](https://eduinformant.com/wp-content/uploads/2018/11/Federal-University-Wukari.png)